Tag Archives: Business Intelligence

Analytics Requirements: Avoid a Y2.xK Crisis

Even though it happens annually, teams building new visualizations often forget to think about the effects of turning over from one year to another.

In today’s fast paced, Agile world, requirements for even the most critical dashboards and visualizations tend to evolve, and development often proceeds iteratively from a scratchpad sketch through successively more detailed versions to release of a “1.0” production version. Organized analytics teams evolve dashboards within a process framework that include checkpoints ensuring standards are met for security, reliability, usability, and so on.

A reporting team can build a revolutionary analytics capability enabling unprecedented visibility into operations, and then, if year turnover isn’t included in requirements, experience embarrassing errors and usability challenges in the January after initial deployment. In effect, the system experiences its own Y2.xK crisis, not too different from the expected Y2K crisis 16 years ago. Continue reading

Tableau Startup: First Lessons Learned

XAs I mentioned in the February post, I’m new to Tableau, and as the tone of that post implied,enjoying it very much. Tableau is a robust and flexible solution for data delivery. Like Qlikview, which I worked with a while ago, it is supported by outstanding, and free, introductory training and a very active user community.

As I’ve made my first steps in Tableau I’ve been a frequent user community visitor, and generally have gotten the answers I’ve been looking for. However, like any tool there still have been a few surprises. I’ll run down the top few in this post:

  • Measures can have complex logic
  • Big extracts are tricky
  • Changing data sources is really tricky
  • Sorry, there are some things you just can’t do

Hopefully this post helps other novices negotiate those first few steps a bit more easily. Continue reading

No Silver BI Bullet: Tableau Edition (It’s a good thing!)

For complex work, a very simple app requires a very smart user. That point was driven home to me in Tableau Fundamentals class this week. I don’t see that as bad news at all.

Not so long ago I wrote a piece that attempted to inject a bit of reality into the claims then made by some data visualization tool vendors. I cited unexpected challenges that those adopting such tools for their obvious and compelling data presentation abilities might face. The challenges included unexpectedly complex data integration, establishing solid reporting standards and practices, scaling report distribution as demand for the visualizations expands, and the conversion work that can result from version upgrades.

Although a Fundamentals class, the experienced and enthusiastic instructor and the small, intelligent student group combined to make the two days immensely valuable, going far beyond the basics on the program (more on specific lessons learned will appear in an upcoming post). The instructor’s focus on principles rather than recipes drove home this point: in order to effectively use Tableau you have to understand not only how to operate Tableau itself but also the underlying data management, usability, and statistics principles.

Could it be that adopting easy-to-use Tableau in place of, say, SSRS, Cognos, or SAS requires an upgrade in staff knowledge and expertise? Continue reading

Levels of Trust in Data Governance: It’s Not All or Nothing

The term “trust” implies absolutes, and that’s a good thing for relationships and art. However, in the business of data management, framing trust in data in true or false terms puts data governance at odds with good practice. A more nuanced view that recognizes the usefulness of not-fully-trusted data can bring vitality and relevance to data governance, and help it drive rather than restrict business results.

The Wikipedia entry — for many a first introduction to data governance — cites Bob Seiner’s definition: “Data governance is the formal execution and enforcement of authority over the management of data and data related assets.” The entry is accurate and useful, but words like “trust”, “financial misstatement”, and “adverse event” lead the reader to focus on the risk management role of governance.

However, the other role of data governance is to help make data available, useful, and understood. That means sometimes making data that’s not fully trusted available and easy to use. Continue reading

No More Enterprise Data Sinks – An Agile Data Warehousing Manifesto

SinkOver the past year I’ve reviewed what seem like countless plans for enterprise data warehouses. The plans address real problems in the organizations involved: the organization needs better data to recognize trends and react faster to opportunities and challenges; business measures and analyses are unavailable because data in source systems is inconsistent, incomplete, erroneous, or contains current values but no history; and so on.

The plans detail source system data and its integration into a central data hub. But the ones I’m referring to don’t tell how the data will be delivered, or portray a specific vision of how the data is to drive business value. Instead, their business case rests on what I’ll call the “railroad hypothesis”. No one could have predicted how the railroads enabled development of the West, so the improved data infrastructure will create order of magnitude improvements in ability to access, share, and utilize data, from which order of magnitude business benefits will follow.* All too often these plans just build bridges to nowhere. Continue reading

Manage DATA, People, Process, and Technology

dataA quick Google search seems to reveal if you manage People, Process, and Technology you’ve got everything covered. That’s simply not the case. Data is separate and distinct from the things it describes — namely people, processes, and technologies — and organizations must separately and intentionally manage it.

The data management message seems a tough one to deliver effectively. Data management interest groups have hammered at it for years, but a sometimes preachy and jargon laden approach relying on data quality train wreck stories hasn’t generally loosened corporate purse strings. Yes, financial companies’ data-first successes in the 1990s paved the way for the ’00s dot com juggernauts, whose market capitalization stems largely from innovative data management. Yet, we still have huge personal data breaches at some of our most trusted companies, and data scientists spend the bulk of their valuable time acquiring, cleaning, and integrating poorly organized data.

The first steps are often the hardest, so here’s a short, no jargon, big picture guide to getting started with effective data management in three steps:

Continue reading

What is Big Data Creativity and How Do You Get It?

Thomas EdisonIn a recent Smart Data Collective post, Bernard Marr cites creativity as a top big data skill, but what is creativity?

His point is, since big data applications are often off the beaten IT path, big data professionals must solve “problems that companies don’t even know they have – as their insights highlight bottlenecks or inefficiencies in the production, marketing or delivery processes,” often with “data which does not fit comfortably into tables and charts, such as human speech and writing.” Continue reading

Three things about “Interview with a Data Scientist”

Chemistry-labRecently, I posted “Interview with a Data Scientist” at my company’s blog site. In it, my friend and colleague Yan Li answers four questions about being a data scientist and what it takes to become one. In my view Yan’s responses provide a bracing reminder that data science is something truly new, but that it rests on universal principles of application development. Continue reading

Guiding Principles for Data Enrichment

The data integration process is traditionally thought of in three steps: extract, transform, and load (ETL). Putting aside the often-discussed order of their execution, “extract” is pulling data out of a source system, “transform” means validating the source data and converting it to the desired standard (e.g. yards to meters), and load means storing the data at the destination.

An additional step, data “enrichment”, has recently emerged, offering significant improvement in business value of integrated data. Applying it effectively requires a foundation of sound data management practices.  Continue reading

Business Intelligence Requirements: The Payoff’s in the Details

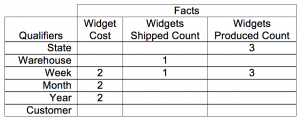
A technique for reporting requirements has emerged as the de facto standard in the business intelligence community. The technique, which emerged in the mid-2000s, is new enough to be as yet unacknowledged Fact Qualifier Matrixby the requirements analysis powers that be. David Loshin describes how it works in this 2007 post:

  • Start with a business question about how to monitor a business process using a metric, like “How many widgets have been shipped by size each week by warehouse?” Continue reading