 In my experience, data management is both a mission critical and an undervalued capability. Perhaps recent customer data losses and regulatory initiatives like GDPR tend to raise the stock of data maturity efforts, but it remains undervalued. For example, any Fortune 1000 firm building end-to-end processes finds that much of the cost goes to translating data from different systems that integrate into the process.
Today we have available stage models like CMMI’s Data Management Maturity Model (DMMM) which, as I’ve written, help organizations assess an organization’s maturity level. However, the DMM model aims to assess data maturity at a single agency. It lacks mechanisms to compare multiple agencies or business functions, and therefore can be difficult to translate to prioritized plans for improvement.
Recently I co-authored, with Manoj Thomas, Joseph Cipolla, and Lemuria Carter, a study introducing techniques for assessing relative data management maturity of different organizations, and different data management capabilities, within a larger enterprise.
How we assessed data management maturity
To help understand maturity of data practices for a US state, over three years we analyzed data management practices and maturity at 15 state agencies. Based on that analysis, we designed and tested a Data Management Maturity (DMM) Index enabling comparative assessment of those agencies.
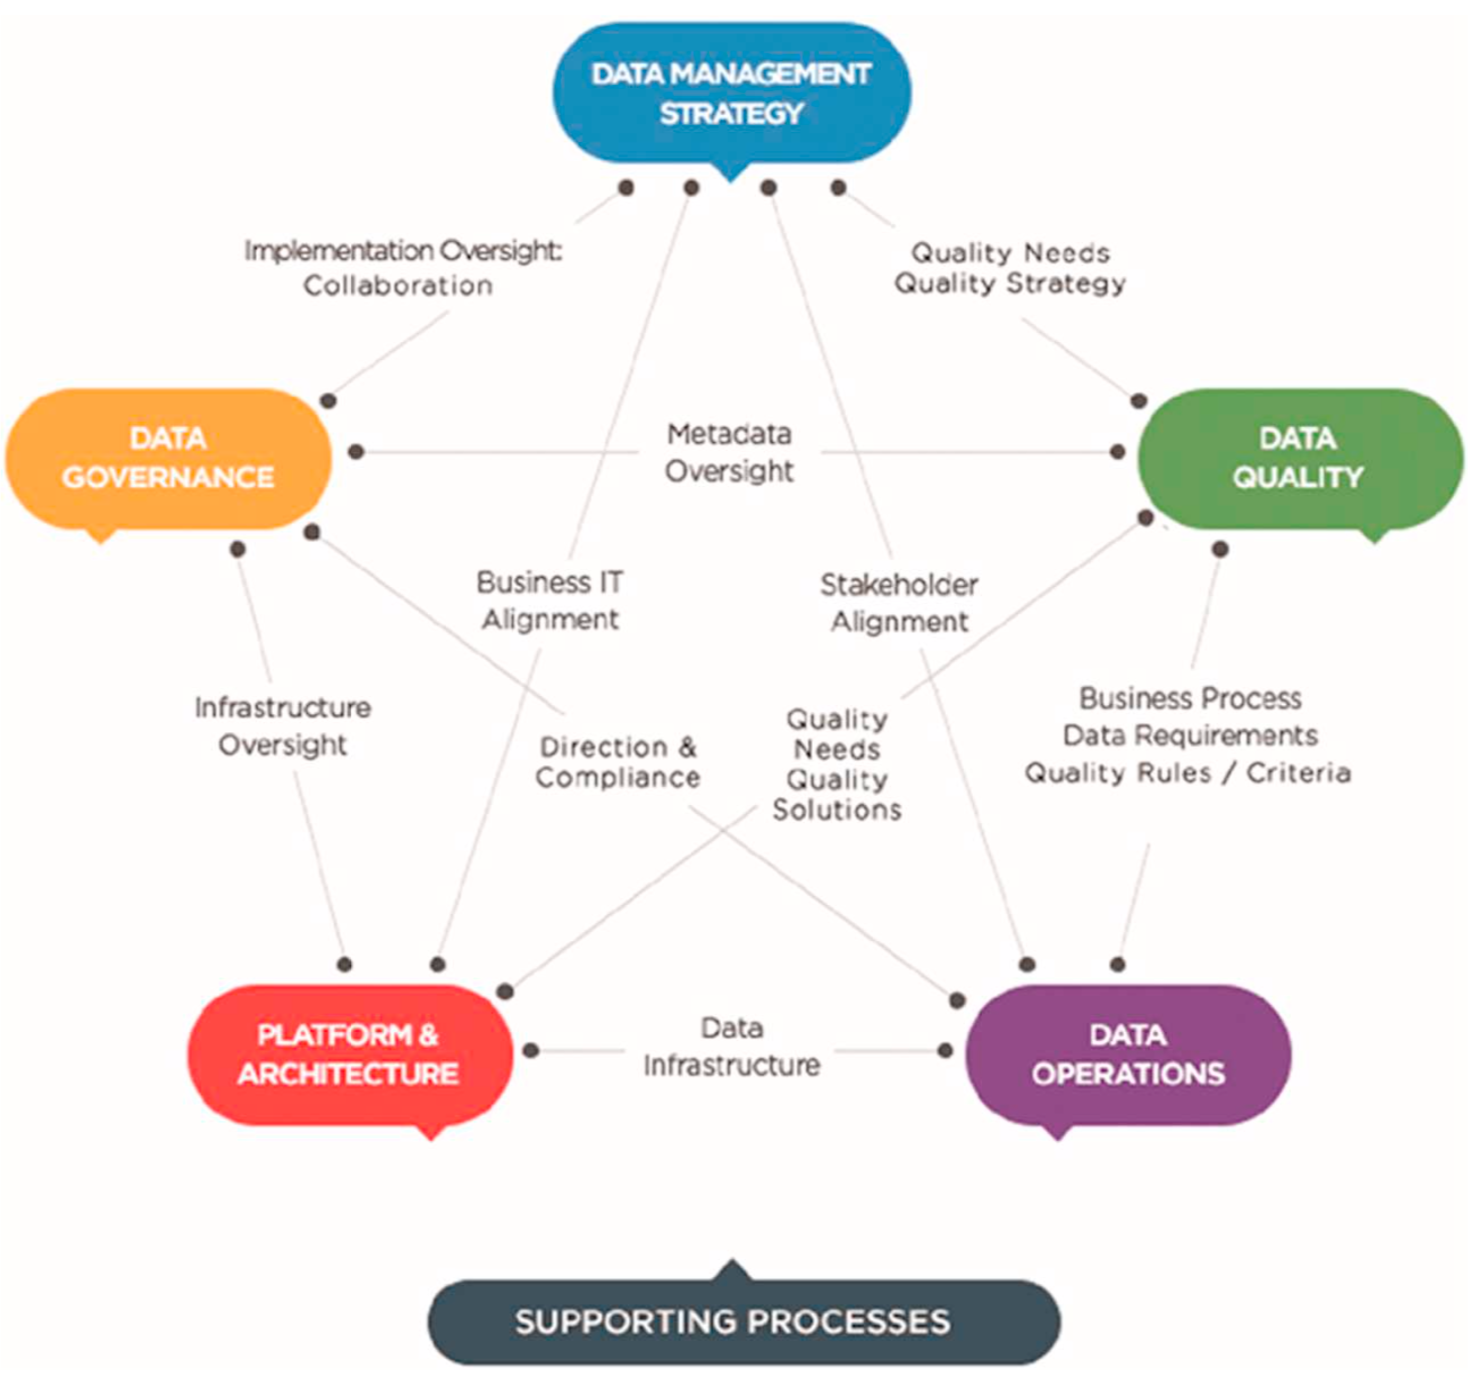
We used the DMMM because in our view the specificity of its analysis would make it particularly effective in identifying specific areas for improvement. The DMMM divides data management into six major categories, each consisting of three to five process areas. For example, the Data Governance category comprises the process areas Governance Management, Business Glossary, and Metadata Management. The DMMM survey consists of 126 questions, about five per process area.
We began with a detailed discussion of the study with a senior State official who identified the 15 participating agencies. Additionally, the senior official identified managers at each agency who would collaborate with the researchers on the study. The managers were those most involved in and knowledgeable of data management practices at their respective agencies, including, where available, Chief Information Officers and Directors of Data Quality Management. The researchers provided a clear description of project and research objectives to all participants prior to the start of the study and made early results available to study participants to insure content validity. To reduce self-reporting bias, when findings were consolidated participants received the findings and a benchmarking report of how their agency compared against other participating agencies.
Researchers collected data using the DMM survey in in-person interviews at each agency after the team gathered and reviewed pertinent agency documents provided by the agency. We applied several techniques described in our paper to ensure consistency and objectivity, and provided completed assessments to interview participants for review. After the assessments were completed, we followed DMMI methodology to assign a maturity level from 1 (Performed) to 5 (Optimized) to each data management process area.
Results and analysis
Maturity levels for the 15 agencies varied, with seven agencies scoring 3 (defined) or 2 (managed), most of the other five scoring 1 (performed). The scores give some idea of the agencies’ maturity ranking, but given that two tie at 2.75, five at 1.75, and five others at 0.5, setting priorities based on need for improvement would be tricky. (Our methodology rounded scores to the nearest whole number, but retained results at two decimal places.)
We found a useful way to break the ties based on ranking the different agencies within each category and calculating a Data Management Maturity Index based on the category rankings. While the two agencies at maturity level three also shared the same index value, there were no other index value ties, and the differences in index values seem to square with intuition based on inspection of process area scores. For example, the bottom two agencies tied with a maturity level rounding to zero, but had maturity indices of 0.14 and 0.05 respectively. One had 16 out of 25 non-zero process area scores, and the other 13 out of 25. So, in this case the different index values correctly identify the agency intuitively in most need of data management improvement.
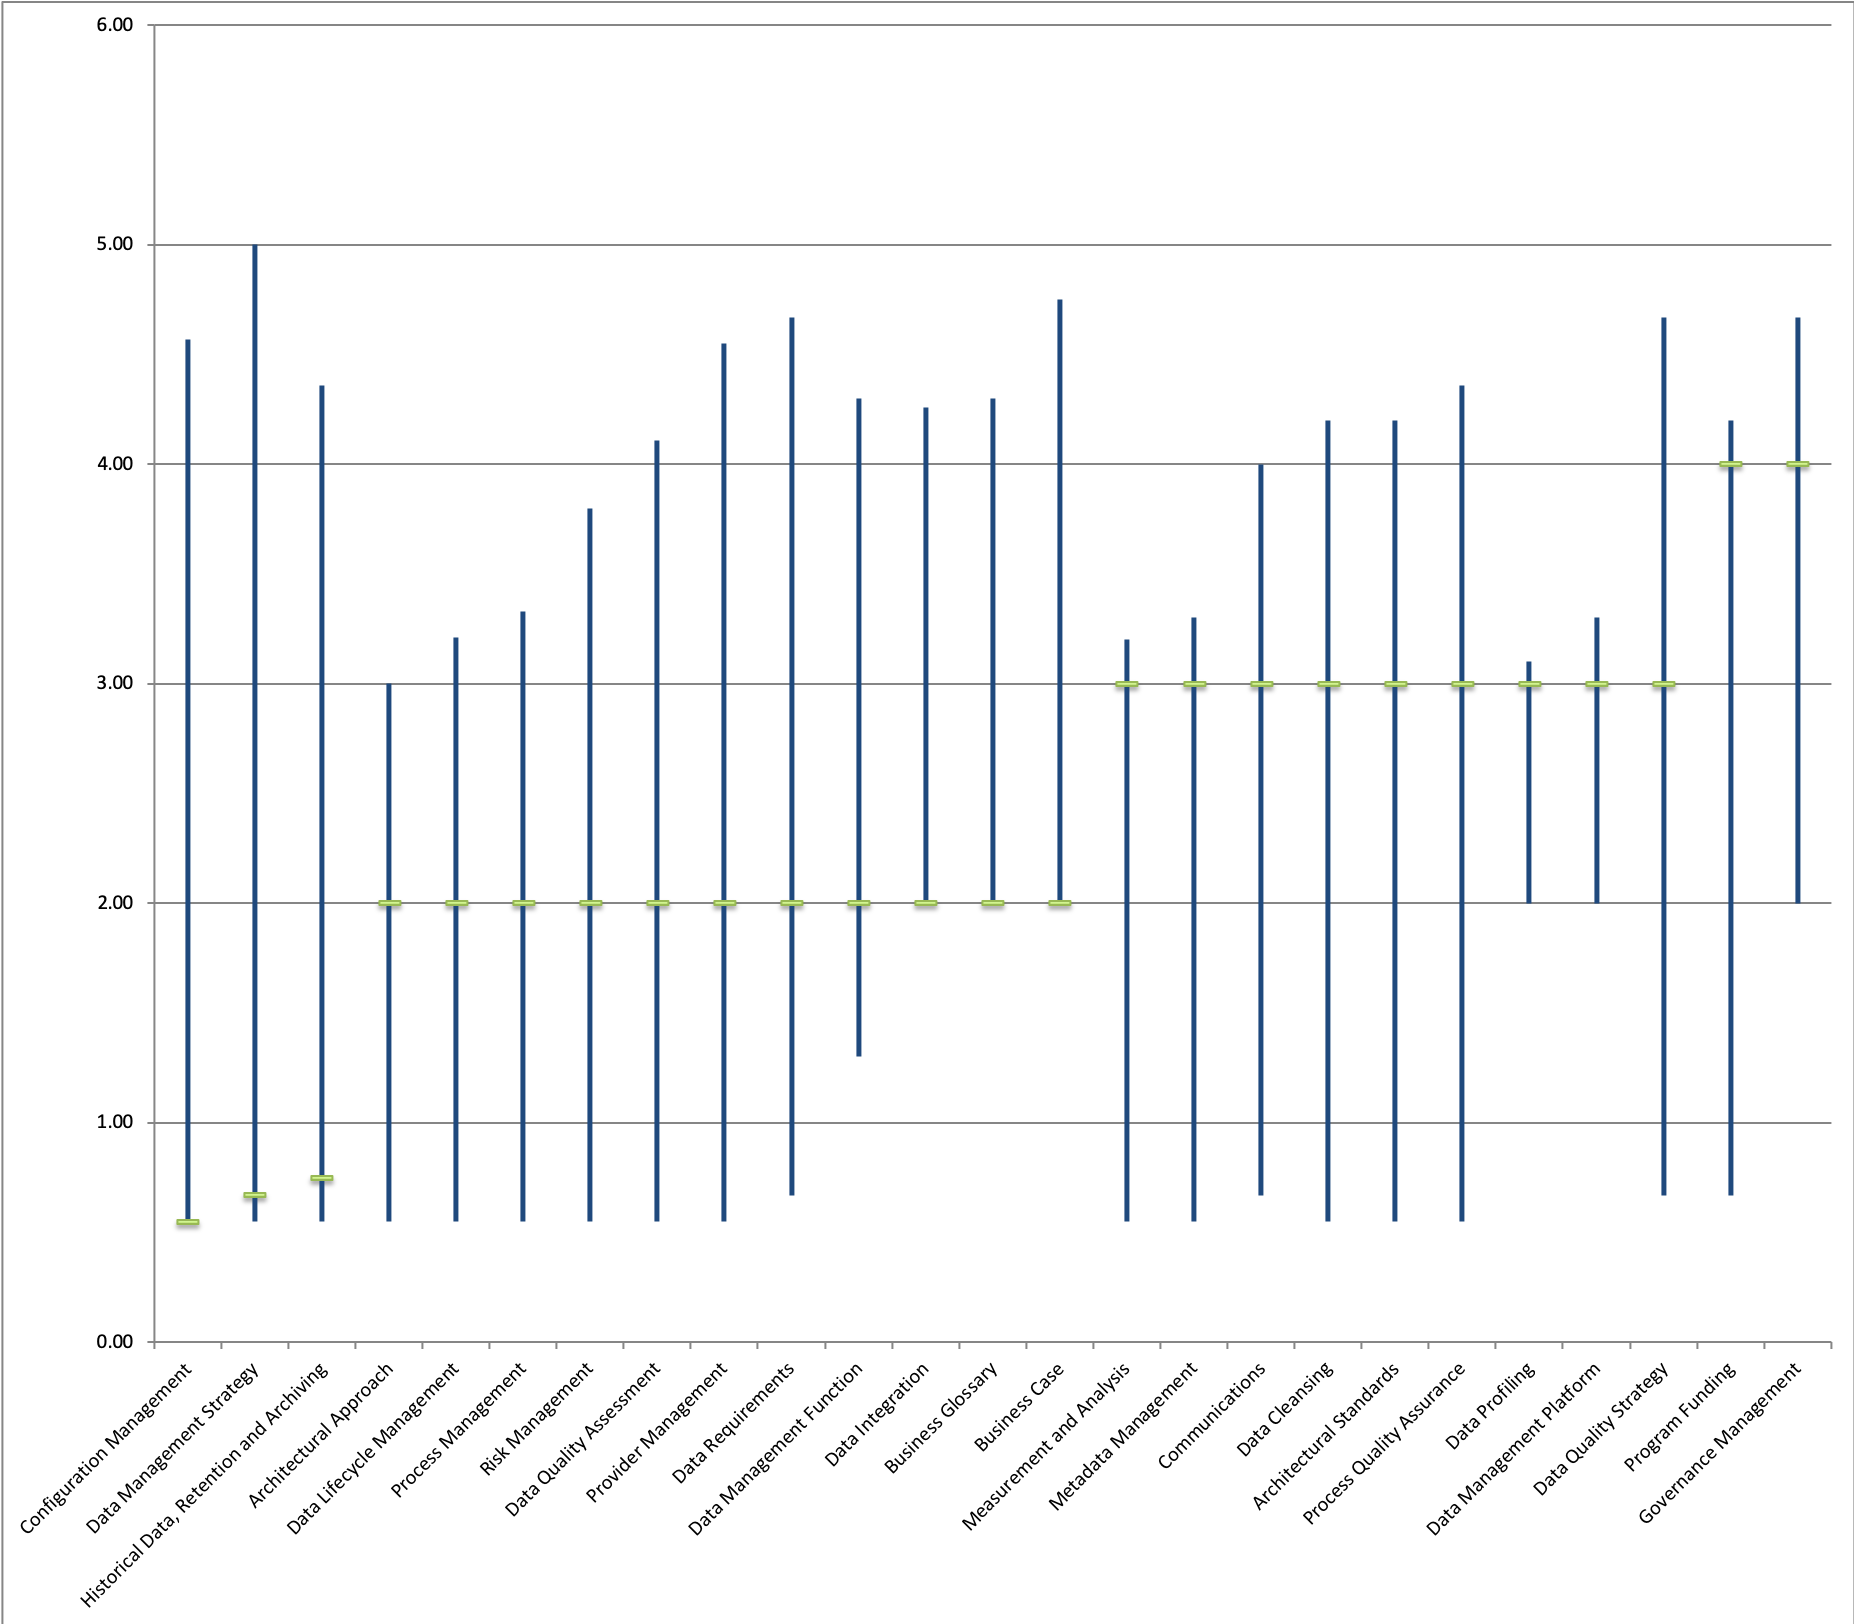 Our paper also provides a way for an organization to assess relative maturity of process areas across the enterprise. To assess relative process area maturity, we grouped process areas by maturity level. The chart above is not based on our paper but instead shows a representative fictitious example whose results track to our findings. The chart presents minimum, maximum, and mode (most frequently occurring value) for each process area. Three process areas in this example clearly emerge as high priority for improvement, Configuration Management, Data Management Strategy, and Historical Data, Retention, and Archiving. For all divisions, the remaining 22 process areas are at level 2 (Managed) maturity.
The way forward
Our study demonstrated that organizations that use the DMMM to assess separate divisions can integrate the results in a way that usefully ranks divisions and data management capabilities.
In effect, the DMMI along with process category rankings can bring maturity study results into focus for strategic data planners by forming the “current state” study of a strategic plan. The plan can use relative maturity rankings of divisions and capabilities, along with a future state vision, to set grounded priorities for data maturity improvements.
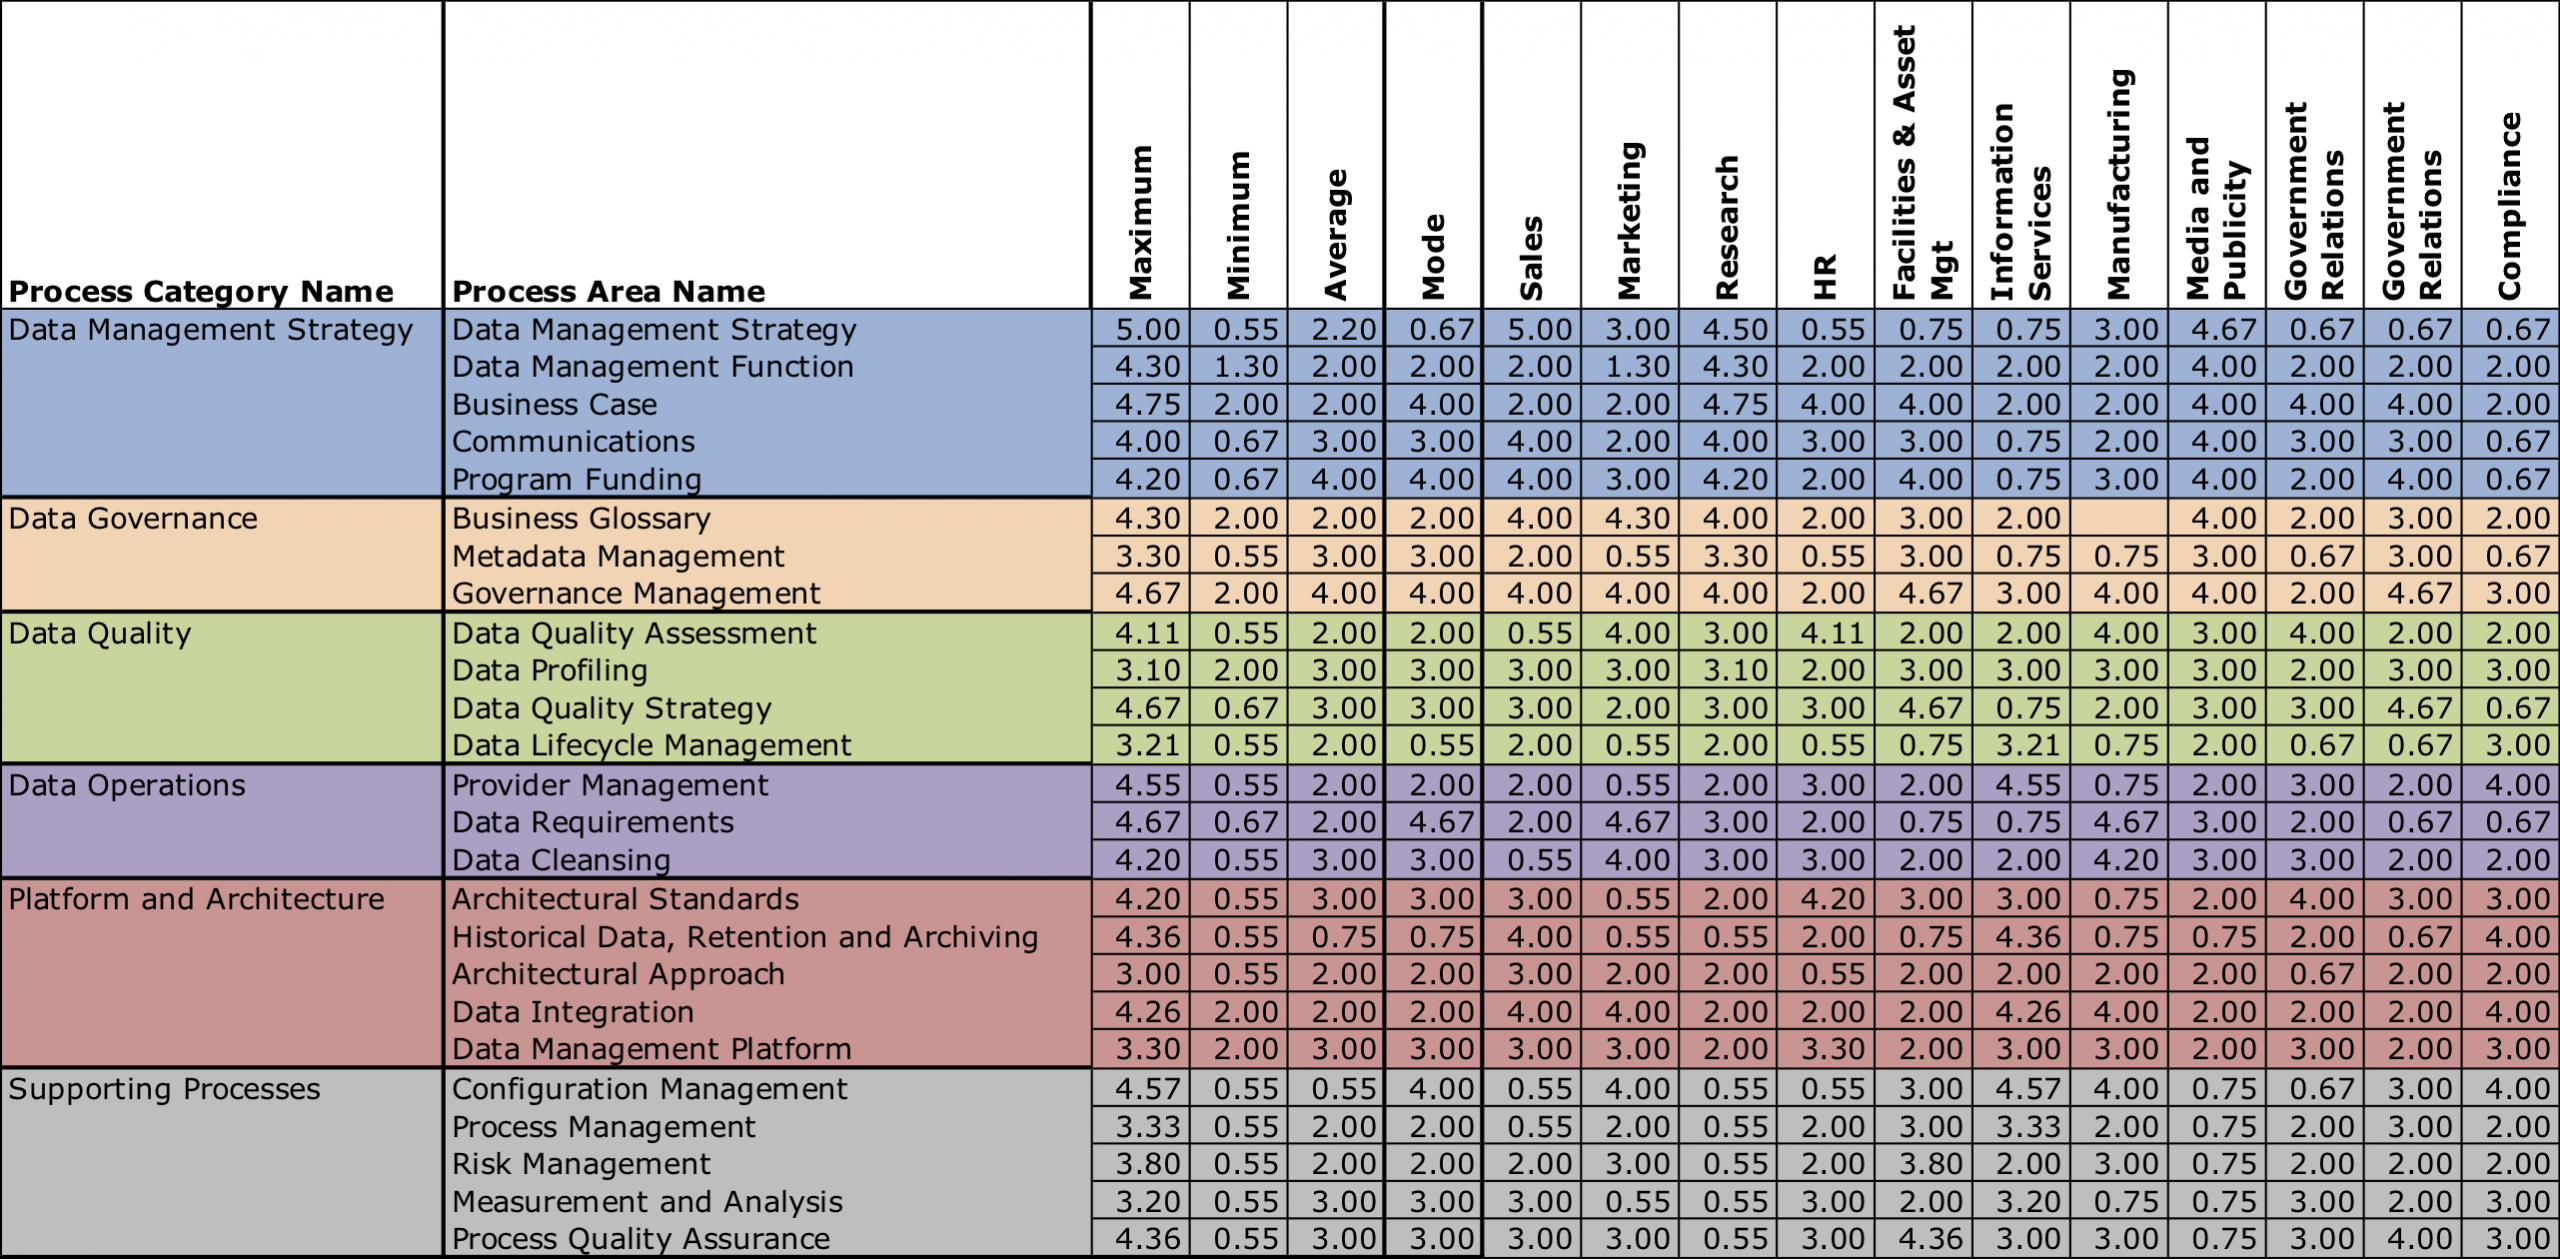
Appendix: Example Process Area Scores
This chart shows the process area scores used to produce the chart above. For the results of the study showing scores from state agencies, please refer to our paper.