Category Archives: Analysis

Tableau Rollout Across Five Dimensions

Standing up any new analytics tool in an organization is complex, and early on, new adopters of Tableau often struggle to include all the complexities in their plan. This post proposes a mental model in the form of a story of how Tableau might have rolled out in one hypothetical installation to uncover common challenges for new adopters.

Tableau’s marketing lends one to imagine that introducing Tableau is easy: “Fast Analytics”, “Ease of Use”, “Big Data, Any Data” and so on. (here, 3/31/2017). Tableau’s position in Gartner’s Magic Quadrant (referenced on the same page) attests to the huge upside for organizations that successfully deploy Tableau, which I’ve been lucky enough to witness firsthand. Continue reading

Analytics Requirements: Avoid a Y2.xK Crisis

Even though it happens annually, teams building new visualizations often forget to think about the effects of turning over from one year to another.

In today’s fast paced, Agile world, requirements for even the most critical dashboards and visualizations tend to evolve, and development often proceeds iteratively from a scratchpad sketch through successively more detailed versions to release of a “1.0” production version. Organized analytics teams evolve dashboards within a process framework that include checkpoints ensuring standards are met for security, reliability, usability, and so on.

A reporting team can build a revolutionary analytics capability enabling unprecedented visibility into operations, and then, if year turnover isn’t included in requirements, experience embarrassing errors and usability challenges in the January after initial deployment. In effect, the system experiences its own Y2.xK crisis, not too different from the expected Y2K crisis 16 years ago. Continue reading

Tableau Startup: First Lessons Learned

XAs I mentioned in the February post, I’m new to Tableau, and as the tone of that post implied,enjoying it very much. Tableau is a robust and flexible solution for data delivery. Like Qlikview, which I worked with a while ago, it is supported by outstanding, and free, introductory training and a very active user community.

As I’ve made my first steps in Tableau I’ve been a frequent user community visitor, and generally have gotten the answers I’ve been looking for. However, like any tool there still have been a few surprises. I’ll run down the top few in this post:

  • Measures can have complex logic
  • Big extracts are tricky
  • Changing data sources is really tricky
  • Sorry, there are some things you just can’t do

Hopefully this post helps other novices negotiate those first few steps a bit more easily. Continue reading

No Silver BI Bullet: Tableau Edition (It’s a good thing!)

For complex work, a very simple app requires a very smart user. That point was driven home to me in Tableau Fundamentals class this week. I don’t see that as bad news at all.

Not so long ago I wrote a piece that attempted to inject a bit of reality into the claims then made by some data visualization tool vendors. I cited unexpected challenges that those adopting such tools for their obvious and compelling data presentation abilities might face. The challenges included unexpectedly complex data integration, establishing solid reporting standards and practices, scaling report distribution as demand for the visualizations expands, and the conversion work that can result from version upgrades.

Although a Fundamentals class, the experienced and enthusiastic instructor and the small, intelligent student group combined to make the two days immensely valuable, going far beyond the basics on the program (more on specific lessons learned will appear in an upcoming post). The instructor’s focus on principles rather than recipes drove home this point: in order to effectively use Tableau you have to understand not only how to operate Tableau itself but also the underlying data management, usability, and statistics principles.

Could it be that adopting easy-to-use Tableau in place of, say, SSRS, Cognos, or SAS requires an upgrade in staff knowledge and expertise? Continue reading

Assumptions: A Key to Technical Leadership

DonkeyThere’s an unfortunate and rather rude saying about assumptions that I’ve found popular among IT folks I’ve worked with. I say unfortunate because, to me, assumptions that are recognized early and handled the right way are a key to successful projects. Technical players who use assumptions well can help set projects on the right path long before they go astray.

Sometimes on waterfall and hybrid projects technical players are asked to estimate work early, before requirements are complete. My instinctive reaction is not to provide an ungrounded estimate, but that’s not helpful. The way to handle this uncomfortable uncertainty is to fill out the unknowns with assumptions: detailed, realistic statements that provide grounding for your estimate. Continue reading

GIGO: Data Quality Guidelines for Application Development

There’s consensus among data quality experts that, generally speaking data quality is pretty much bad (here, here, and here). Data quality approaches generally focus on profiling, managing, and correcting data after it is already in the system. This makes sense in a daGIGOta science or warehousing context, which is often where quality problems surface. To quote William McKnight at the first of those sources:

“Data quality is no longer the domain of just the data warehouse. It is accepted as an enterprise responsibility. If we have the tools, experiences, and best practices, why, then, do we continue to struggle with the problem of data quality?”

So if the data quality problem is Garbage In Garbage Out (GIGO), then I would think that it would be easy to find data quality guidelines for app dev, and that those guidelines would be lightweight and helpful to those projects. Based on my research there are few to none such sources (please add them to the comments if you find otherwise).

So, all that said here’s my cut at app dev data quality guidelines by project activity: Continue reading

Get Business Requirements Right by Resolving Many-to-Manys

Logical data modeling is one of my tools of choice in business analysis and requirements definition. That’s not particularly unusual – the BABOK (Business Analysis Body of Knowledge) recognizes the Entity-Relationship Diagram (ERD) as a business analysis tool, and for many organizations it’s a non-optional part of requirements document templates.

In practice, however, data models in requirements packages often include many-to-many relationships. I’ve heard experienced data modelers advocate this practice, and it unfortunately seems consistent with the “just enough, just in time” approach associated with agile culture.

In my experience unresolved M:M relationships indicate equally unresolved business questions. The result: schedule delays and budget overruns as missed requirements are built back in to the design, or the familiar “that’s not what we wanted” reaction during User Acceptance Testing (UAT). Continue reading

A Field Guide to Overloaded Data

BugAt the very first TDWI Conference, Duane Hufford described a phenomenon he called “embedded data”, now more commonly called “overloaded data”, where two or more concepts are stuffed into a single data field (“Metadata Repositories,” TDWI Conference 1995). He described and portrayed in graphics three types of overloaded data. Almost 20 years later, overloaded data remains rampant but Mr Hufford’s ideas, presented below with updated examples, are unfortunately not widely discussed.

[Note: in March of 2021 I added one further category, bundling. – BL]

Overloaded data breeds in areas not exposed to sound data management techniques for one reason or the other. Big data acquisition typically loads data uncleansed, shifting the burden of unpacking overloaded fields to the receiver (pity the poor data scientist spending 70% of her time acquiring and cleaning data!)

One might refer to non-overloaded data as “atomic”. Beyond making data harder to use, overloaded data requires more code to manage than atomic data (see why in the sections below) so by extension it increases IT costs.

Here’s a field guide to three different types of overloaded data, associated risks, and how to avoid them: Continue reading

Three things about “Interview with a Data Scientist”

Chemistry-labRecently, I posted “Interview with a Data Scientist” at my company’s blog site. In it, my friend and colleague Yan Li answers four questions about being a data scientist and what it takes to become one. In my view Yan’s responses provide a bracing reminder that data science is something truly new, but that it rests on universal principles of application development. Continue reading

Data Design Matters

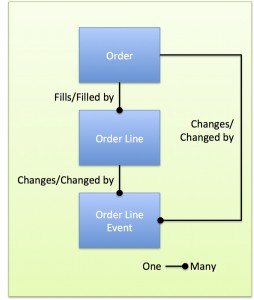
OrderModelAs important as it is, data modeling has always had a geeky, faintly impractical tinge to some. I’ve seen application development projects proceed with a suboptimal, “good enough”, model. The resulting systems might otherwise be well-architected, but sometimes strange vulnerabilities emerge that track directly to data design flaws.

Recently I saw an example where a “good enough” data design, similar to the one pictured, enabled a significant application bug.

Continue reading